


Overview
Investor Relations
In the financial year 2021-22, the Company’s revenue increase by 32.07% from INR 80,297 Lakh to INR 106,052 Lakh.
Publication Growth
26.09%
with a turnover of ₹ 1,06,052 Lacs as compared to ₹ 80,297 Lacs in the previous FY 2020-21.
Stationery Growth
35.10%
with a turnover of ₹ 1,06,052 Lacs as compared to ₹ 80,297 Lacs in the previous FY 2020-21.


Financials
We believe in being transparent with all our stakeholders and sharing correct data year by year so that you can partner in our growth story. Here are 5 Years Financial Highlights – Standalone (INR in Lacs).
Shareholding Pattern
We owe our success to our team members and stakeholders who have invested their faith in us as a corporate entity with immense growth potential.
Corporate Governance
Built on the pillars of transparency, accountability and security, the Corporate Governance facilitates effective, entrepreneurial, and prudent management for us that ensures long-term success.
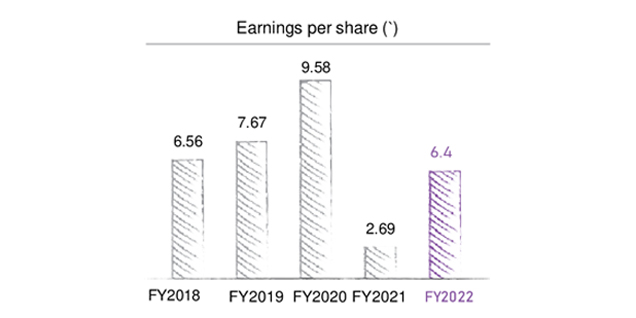
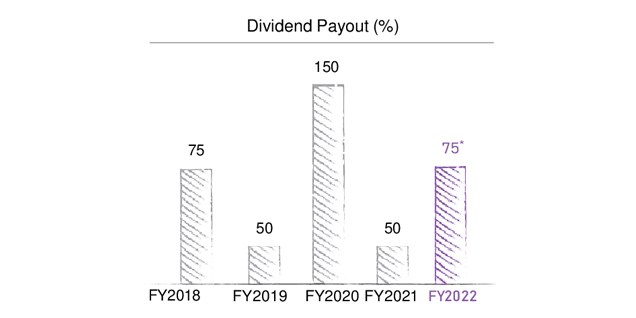
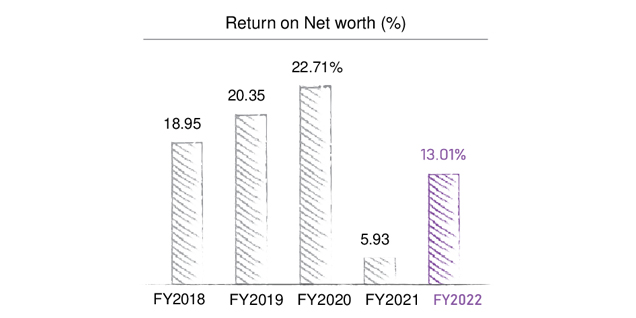
5-Year financial highlights – Standalone (in INR lacs)
| # | 2021-22 | 2020-21 | 2019-20 | 2018-19 | 2017-18 |
|---|---|---|---|---|---|
| Revenue | 108,071 | 81749 | 146,719 | 137,992 | 116,145 |
| PBDIT | 19,035 | 12585 | 34,351 | 30,703 | 26,392 |
| Interest | 368 | 684 | 1,307 | 1186 | 597 |
| PBDT | 18,667 | 11901 | 33,044 | 29,517 | 25,794 |
| Depreciation | 3,270 | 3473 | 3,529 | 2,446 | 2,349 |
| PBT | 15,397 | 8428 | 29,514 | 27,071 | 23,445 |
| Tax | 5,315 | 2265 | 7,579 | 9,324 | 8,124 |
| PAT | 14,662 | 6163 | 21,935 | 17,747 | 15,322 |
| PAT Margin(%) | 9.51 | 8.16 | 16.39 | 13.04 | 13.53 |
| No. Equity Shares | 226,213,181 | 228,870,500 | 228,870,500 | 228,870,500 | 233,558,000 |
| Equity Capital | 4,524 | 4,577 | 4,577 | 4,577 | 4,671 |
| Book Value | 49.83 | 45.4 | 42.2 | 38.1 | 34.6 |
| Dividend | 3,393 | 2,289 | 6,866 | 2,289 | 3,503 |
| Dividend(%) | 75 | 100 | 150 | 50 | 75 |
| Dividend Payout % to Net Profits | 23.1 | 44.7 | 37.7 | 15.5 | 27.5 |
| Reserves & Surplus | 108,190 | 99,309 | 91,995 | 82,619 | 76,170 |
| Gross Block | 56,280 | 54100 | 52,196 | 44,372 | 43,193 |
| Net Block | 20,487 | 21675 | 22,127 | 18,698 | 17,724 |
| Net Worth | 112,339 | 103,887 | 96,572 | 87,196 | 80,841 |
| Return on Net Worth(%) | 0.13 | 5.9 | 22.7 | 20.4 | 19.0 |
| EPS (Pre-Tax) (Rs. 2 /- per share) | 6.8 | 3.7 | 12.9 | 11.8 | 10 |
| EPS (Post Tax) (Rs. 2 /- per share) | 6.5 | 2.7 | 9.6 | 7.7 | 6.6 |
| CEPS (Pre-Tax) (Rs. 2 /- per share) | 8.3 | 5.2 | 14.4 | 12.8 | 11.0 |
| CEPS (Post Tax) (Rs. 2 /- per share) | 7.9 | 4.2 | 11.1 | 8.7 | 7.6 |
SHARE PRICES
| FY | High(₹) | Low (₹) |
|---|---|---|
| 2020 - 2021 | 121.55 | 72.70 |
| 2019 - 2020 | 119.50 | 87.00 |
| 2018 - 2019 | 158.35 | 99.15 |
| 2017 - 2018 | 193.60 | 127.75 |
| 2016 - 2017 | 174.70 | 82.05 |
| 2015 - 2016 | 113.90 | 76.10 |
| 2014 - 2015 | 119.7 | 57.00 |
Demat
99.09% of the total paid up share capital has been demated until 30th June, 2022.
Paid-Up Equity Shares: 22,62,13,181 Equity Shares of Rs. 2/- each as on 30th June, 2022.
36th Annual General Meeting:
Date & Time : Monday, 8th August, 2022 | 11:00AM (IST)
Venue : Virtual AGM through Video Conference / Other Audio Visual Means
Dividend paid in the last 5 years
| Year | Dividend | Details |
|---|---|---|
| 2021 - 2022 | Final Dividend | 75% |
| 2020 - 2021 | Final Dividend | 50% |
| 2019 - 2020 | 2nd Interim Dividend | 25% |
| 2019 - 2020 | Interim Dividend | 125% |
| 2018 - 2019 | Final Dividend | 50% |
| 2017 - 2018 | Final Dividend | 75% |
NSE
BSE
Investors Contact
Company Secretary – Amit Buch
Secretarial Department – Chetan Desai
Nodal Officer – Amit Buch
Email id: investors@navneet.com
Registrar & Share Transfer Agent:
MUFG Intime India Private Limited (Formerly Link Intime India Private Limited)
C-101, 247 Park,
LBS Marg, Vikhroli (West),
Mumbai- 400083
Tel. No. 810 811 6767
Note – To raise an email query, following is the link
https://web.in.mpms.mufg.com/Helpdesk/Service_Request.html
Website – www.in.mpms.mufg.com